The “polar vortex” that memorably descended over Wisconsin starting in January 2014 wasn’t really all that bad, at least when considered in the context of 66 years of weather data for the Northern Hemisphere’s lower troposphere (that is, one mile above the ground).
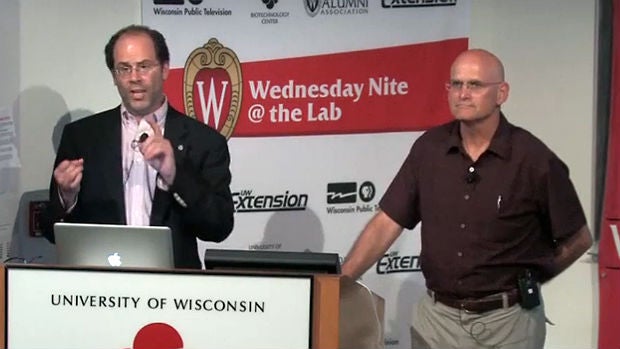
That’s the perspective shared by Jonathan Martin, a meteorology professor at the University of Wisconsin-Madison, in a talk at the campus’ “Wednesday Nite @ The Lab” science series on June 25, 2014. He and fellow “Weather Guy” Steve Ackerman, also a professor with UW-Madison’s Department of Atmospheric and Oceanic Sciences, discussed winter weather conditions, and how meteorological conditions can help inform research into climate change.
Studying the lower troposphere is a newer way for scientists to research climate change, and weather forecasters already pay attention to it, especially during the winter, explained Martin. For December 2013 through February 2014, Martin mapped out an area one mile above the ground of the Northern Hemisphere where the air temperature was colder than minus 5 degrees Celsius. That area (measured in millions of square kilometers) gets larger as the temperature falls. A comparison of the 2013-2014 day-to-day change of that average area to the long-term average of each day over 66 years showed that despite the polar vortex, that memorably cold winter actually had a smaller area of the atmosphere with temperatures below minus 5 degrees Celsius.
Stay informed on the latest news
Sign up for WPR’s email newsletter.
Along with discussing this research, Martin and Ackerman took a variety of questions from the audience in their talk, which was recorded for Wisconsin Public Television’s “University Place” program. They also offered a look behind the scenes of their appearances on Wisconsin Public Radio’s “The Larry Meiller Show” every month.
Key Facts:
- Scientists are determining climate trends by analyzing air temperatures in the lower troposphere 1 mile above the Earth’s surface. These data are collected from hundreds of weather balloons covering millions of square kilometers above the Northern Hemisphere. One benefit of this approach is to avoid having to account for influences on surface temperatures caused by cities and where thermometers are placed.
- These temperature data are used to calculate the area in square kilometers where lower-troposphere temperatures are colder than minus 5 degrees Celsius. The winter of 2013-2014, which featured the “polar vortex” in North America, was the warmest winter by this measure since 1948.
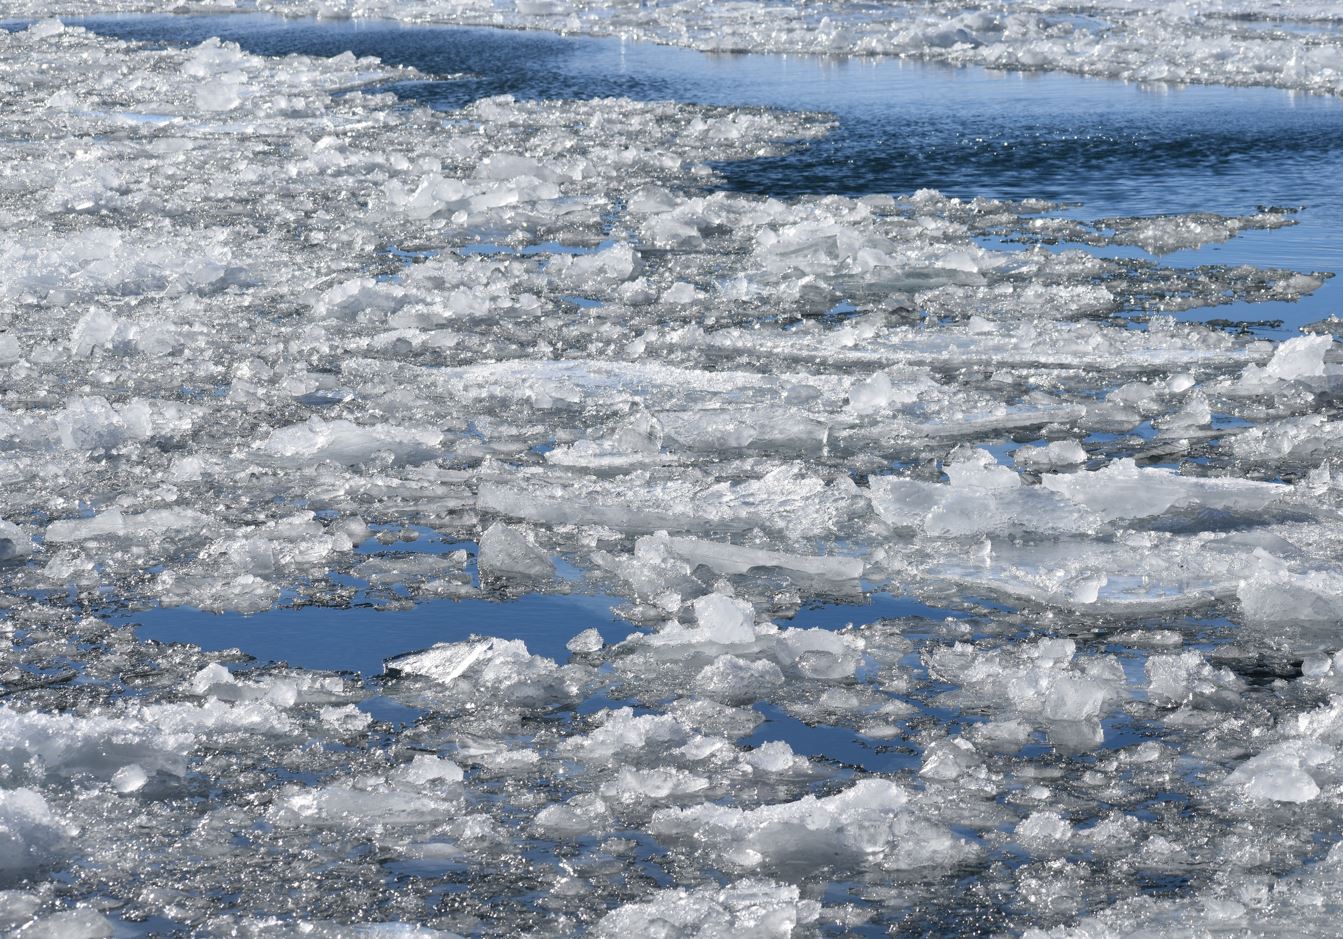
- From 1973 to 2013, the long-term average of the Great Lakes surface area covered by ice was 51.4 percent. The year with the highest ice coverage was 1979 at 94.7 percent of surface area, while 2002 was the all-time minimum at 9.5 percent.
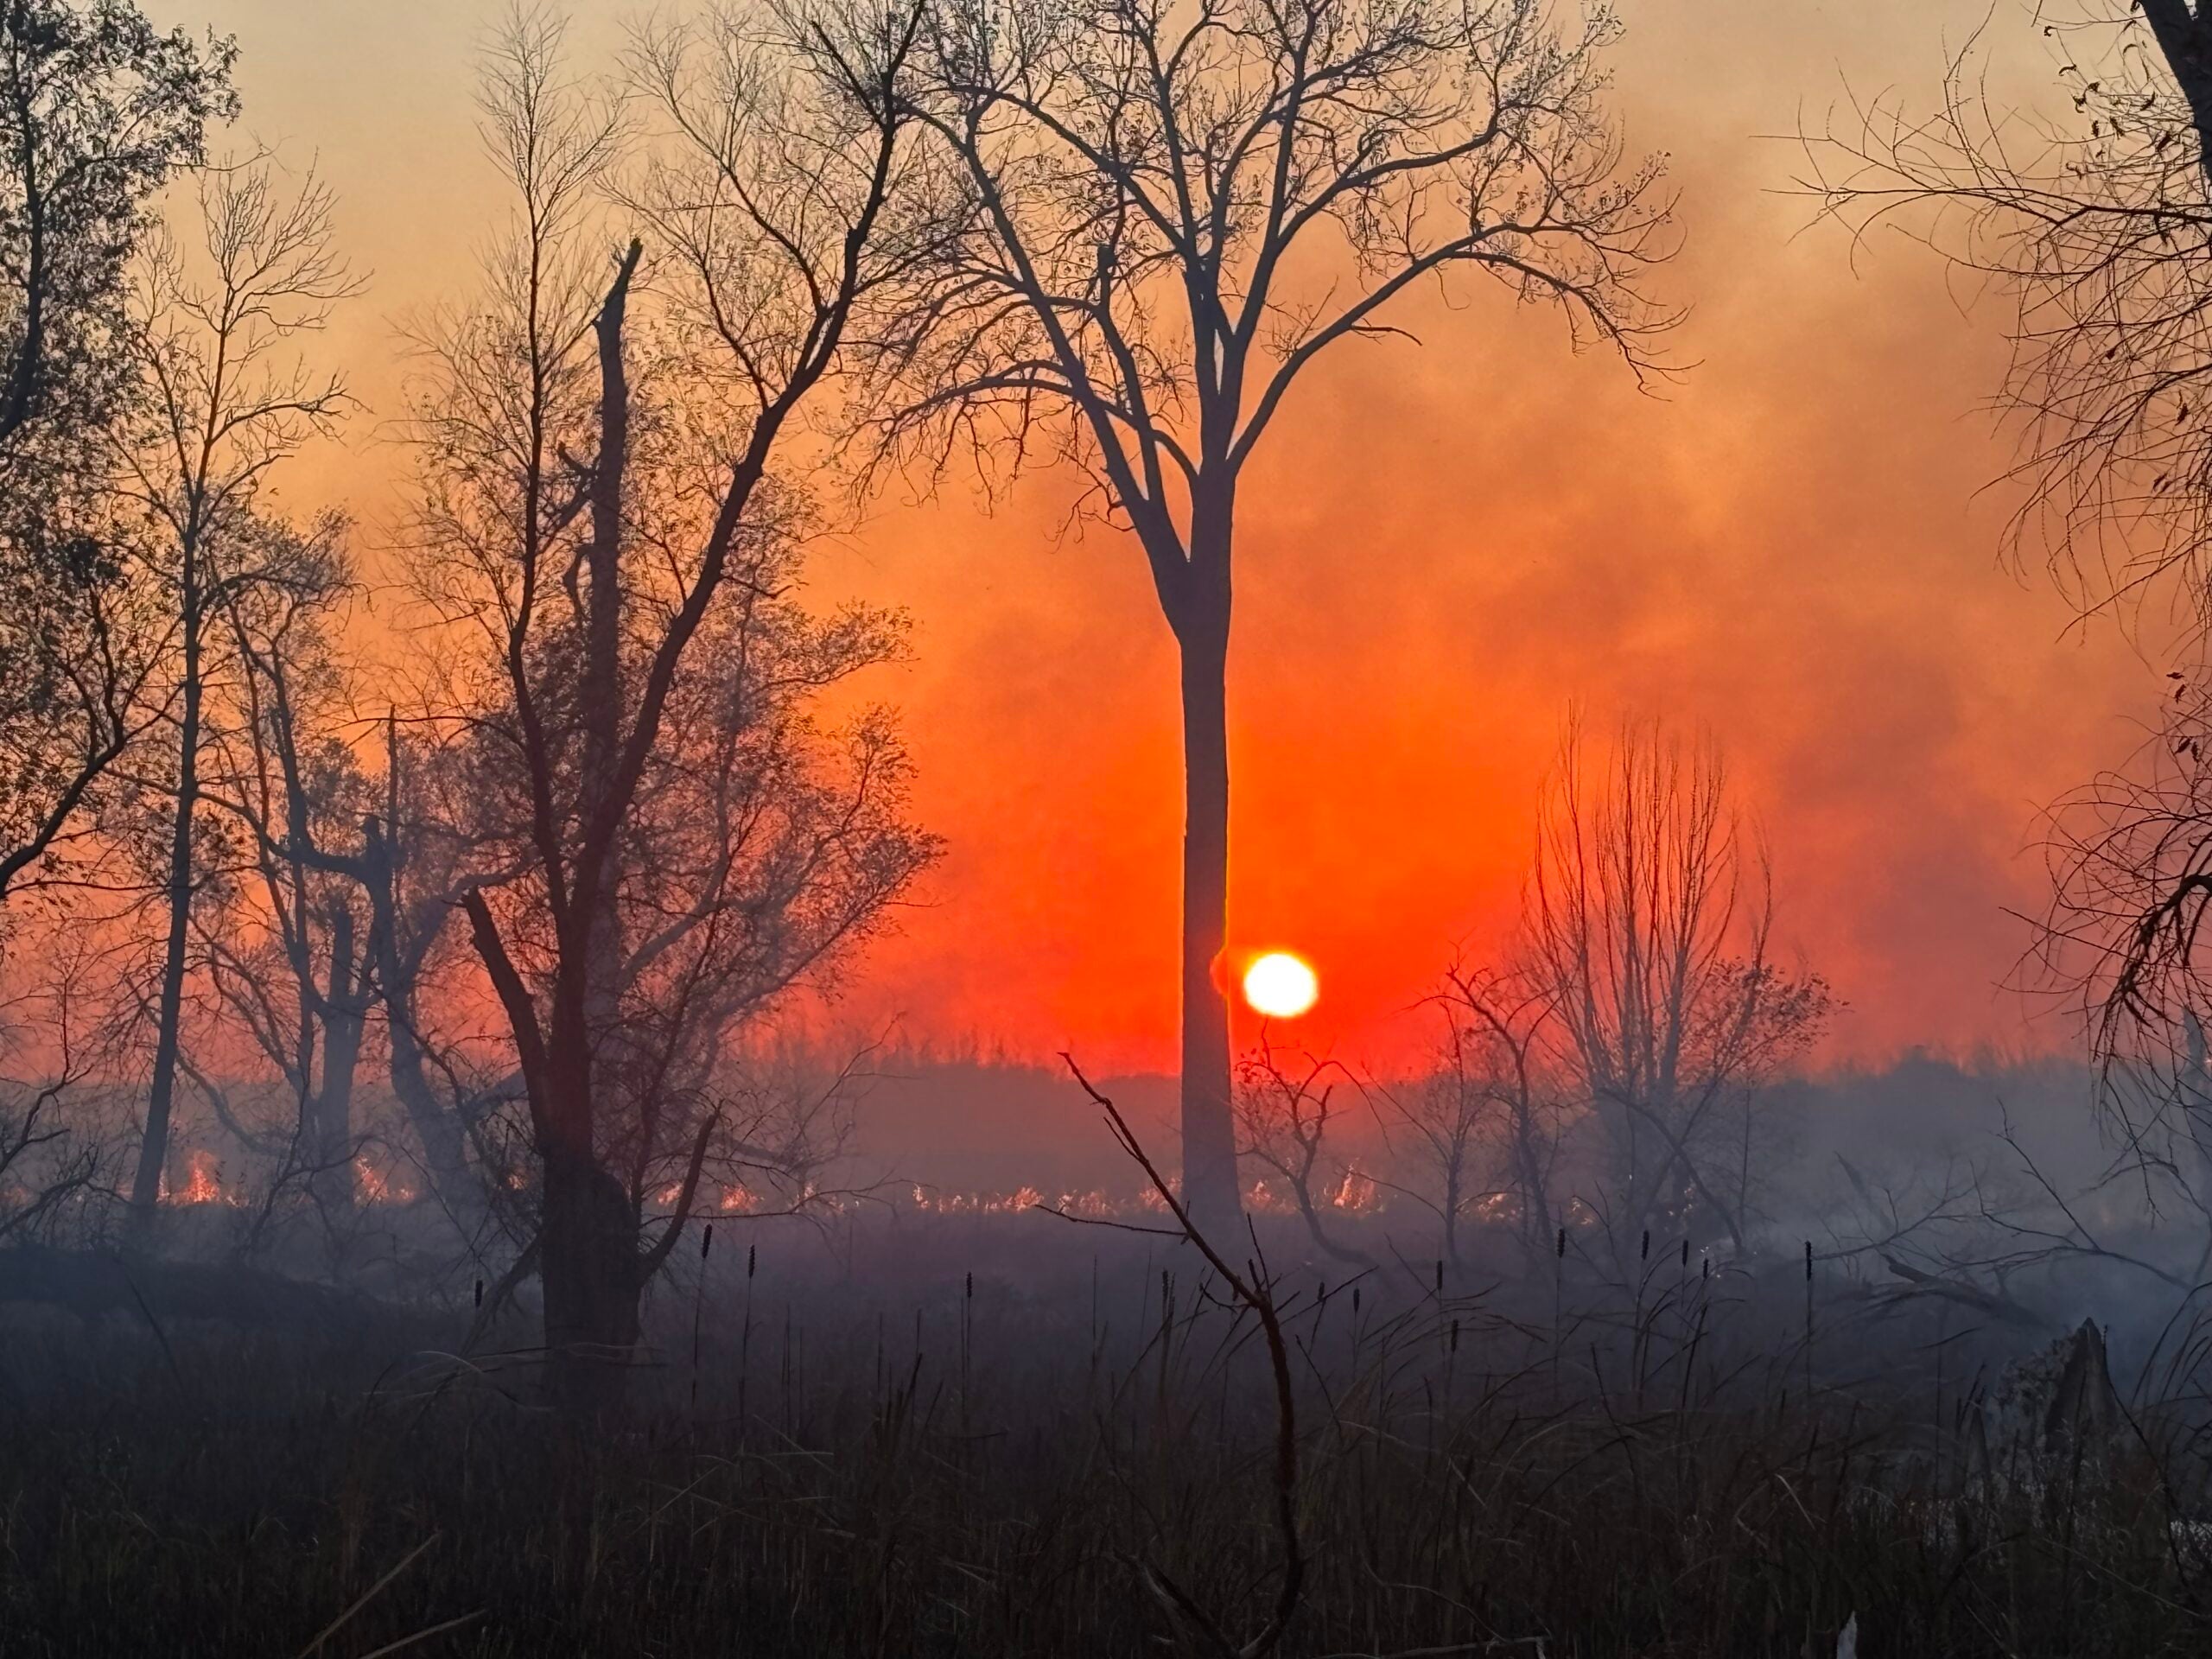
- The winter of 2013-14 had 39 calendar days in which the temperature was below zero degrees Fahrenheit at some point during the day, but very few record low temperature readings were set in the winter of 2013-14.
- The Weather Guys have appeared on Wisconsin Public Radio since 1998. Their monthly appearances on “The Larry Meiller Show” typically run 33 to 36 minutes, and they get an average of 13 callers per session.
Key Statements:
- Martin on the difference between weather and climate: “We’re regionally freezing cold all winter long — that was delivered to us by weather. The background climate is completely in the opposite direction. … That’s what we’re trying to wrestle with in our science right now, is trying to figure out how do you separate weather from climate in an intelligent scientific way.”
- Martin on the value of measuring lower troposphere temperatures: “There’s all kinds of caveats people have to use in order to make statements about surface temperature trends, and those caveats allow skeptics to have fuel to say, ‘Well, you don’t really know what you’re talking about. And if you go to a level that’s a little bit above the ground free from some of that problem, you can say some new things that actually happen to corroborate what’s being said everywhere else. In addition, that level is one that day-to-day weather forecasters, in the wintertime particularly, pay attention to.”
- Martin on troposphere temperatures during the winter of 2013-14: “Almost every single calendar day (that) winter was warmer than normal by this measure across the hemisphere.”
- Martin on analyzing troposphere air temperatures: “The minus 5 line is a pretty good indicator of the boundary between rain and snow. So by choosing that line, I think I’m hoping to invite a community of people to look at this problem who might not otherwise care about it, but they say, oh, yeah, ‘Minus 5, I think about that a lot because it has to do with rain or snow.’”
- Ackerman on climate change and the Great Lakes: “If our winters are going to get shorter, then there won’t be as much ice on the lakes, and that will increase evaporation and could lower levels in the Great Lakes.”
This report was produced in a partnership between Wisconsin Public Radio, PBS Wisconsin and the University of Wisconsin Cooperative Extension. @ Copyright 2025, Board of Regents of the University of Wisconsin System and Wisconsin Educational Communications Board.