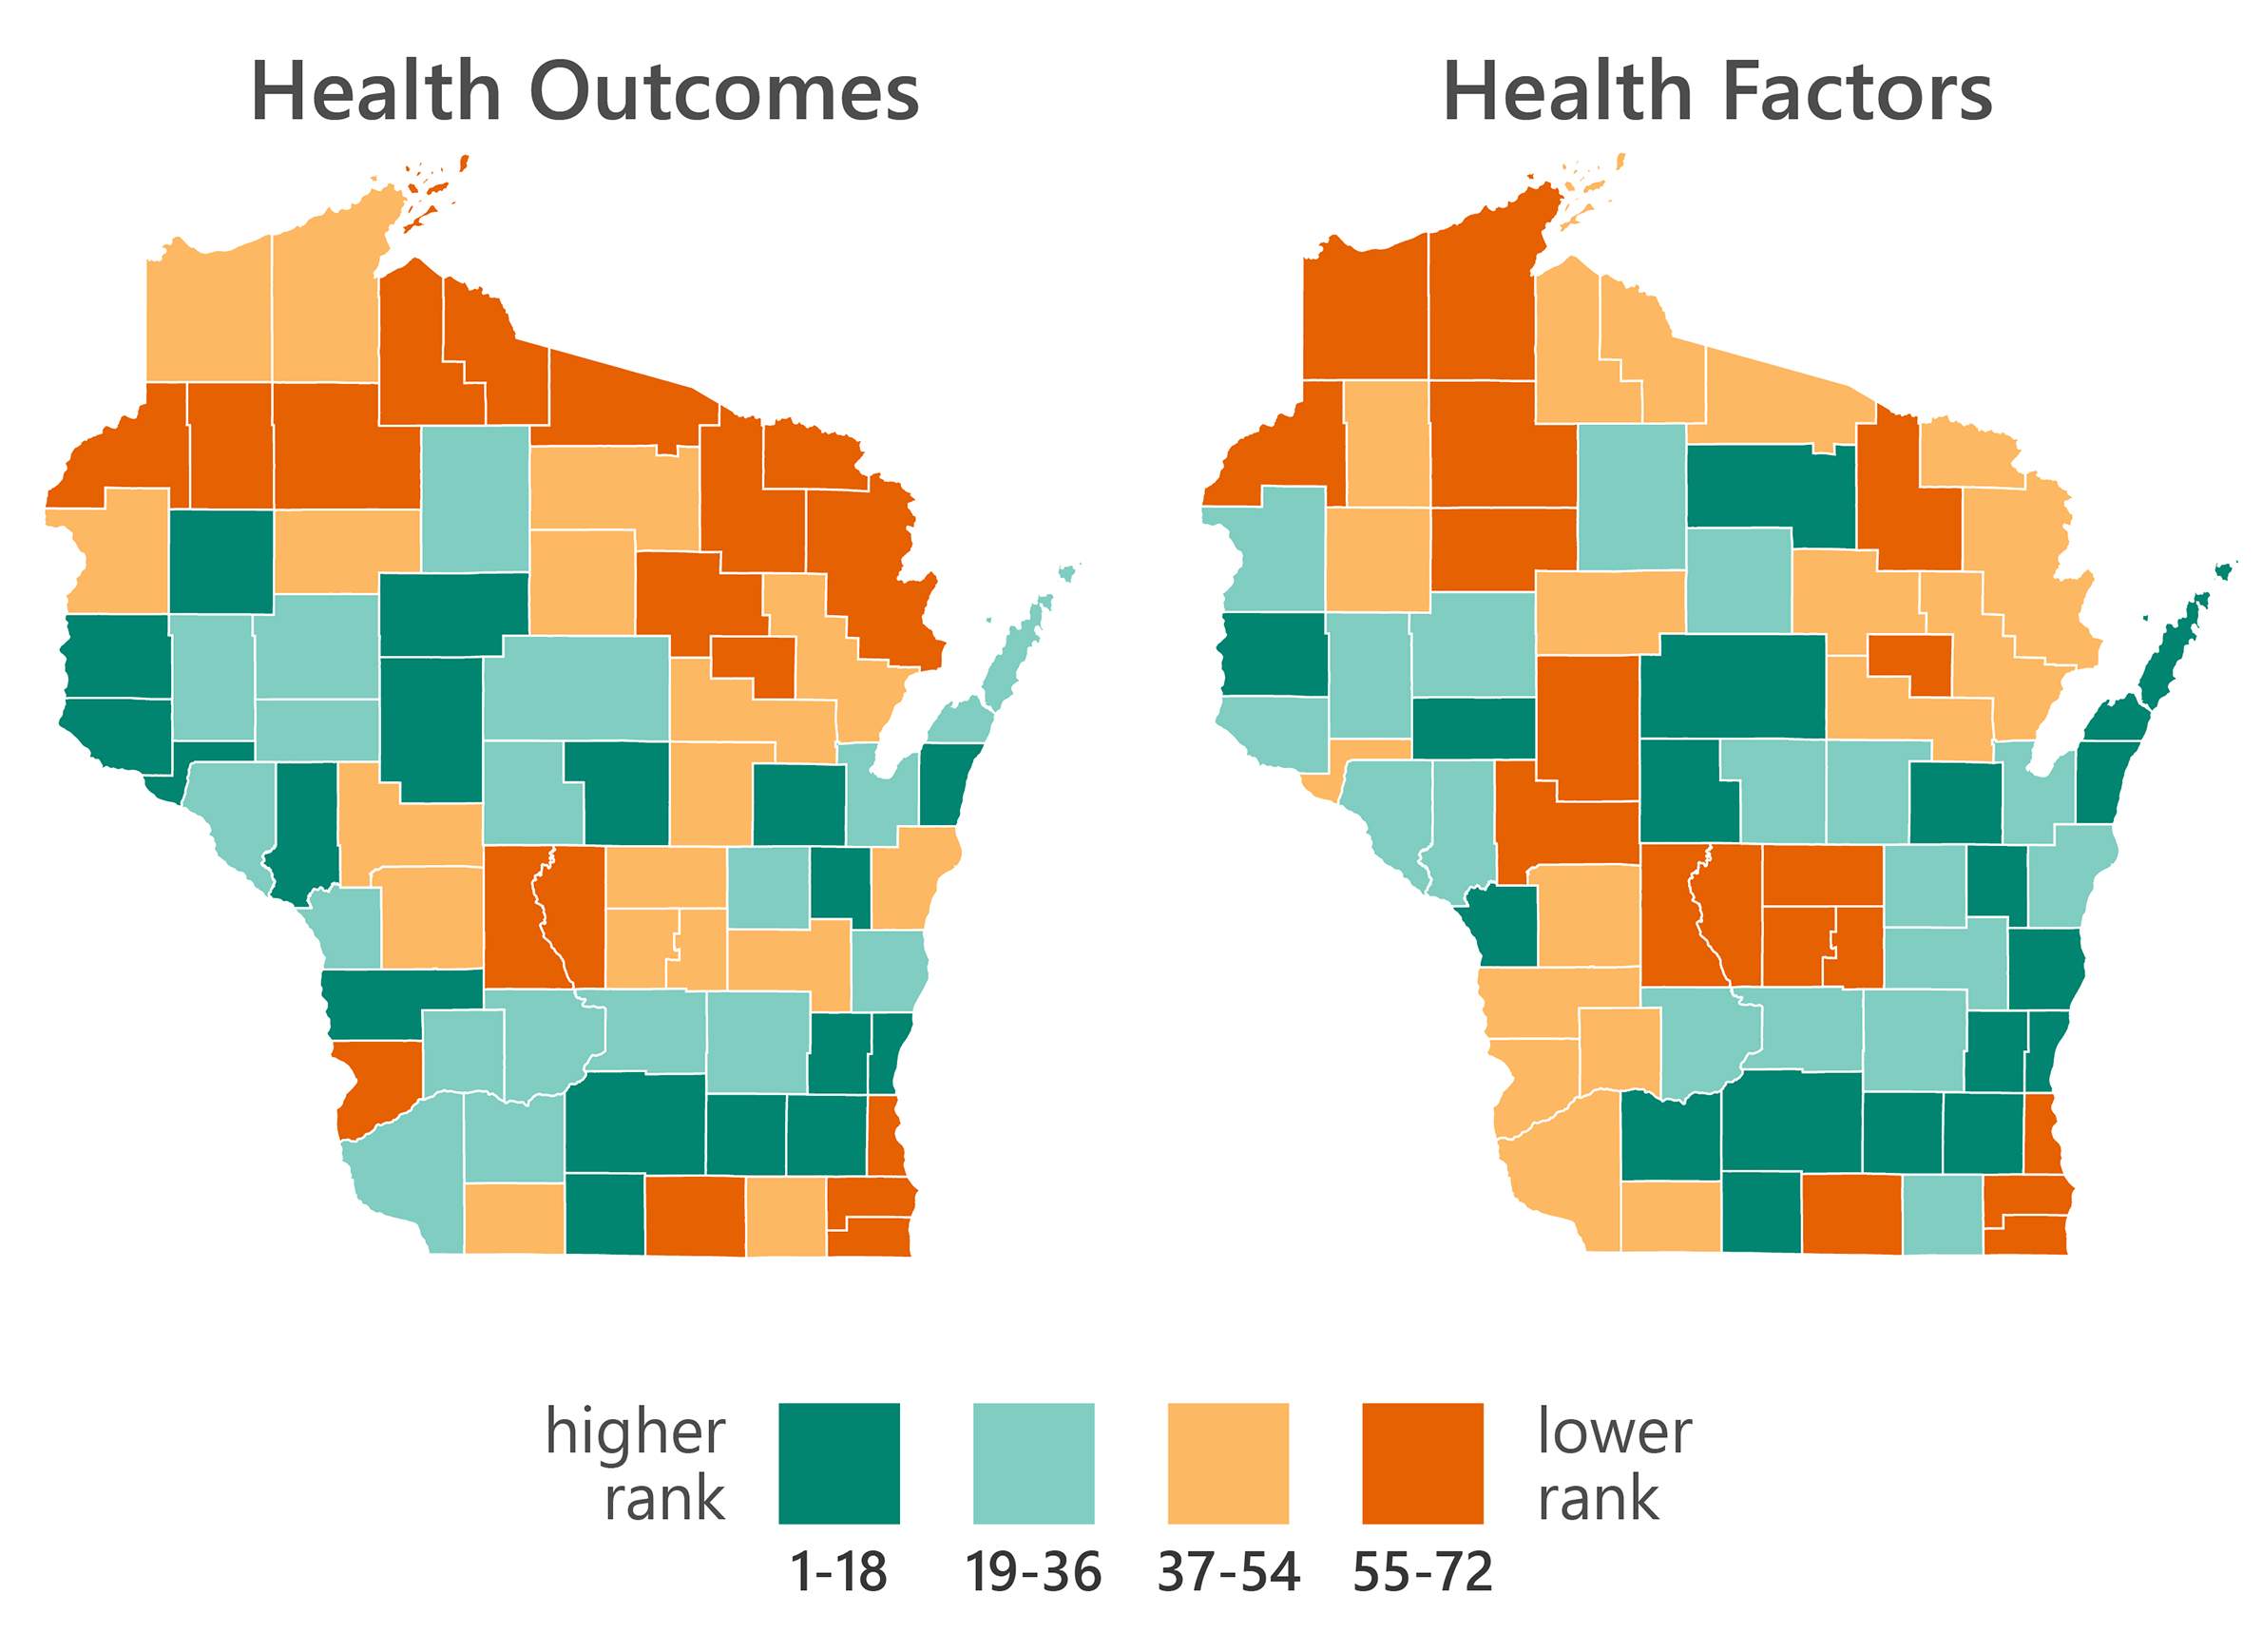
Health is strongly influenced by where people live. Key factors that shape the health of Wisconsinites differ around the state, as does overall health. The factors affecting how healthy people in a community are include rates of smoking, poverty levels, access to health care services, and even commuting patterns. These factors help to create differences in both quality and length of life in all of Wisconsin’s 72 counties.
Stay informed on the latest news
Sign up for WPR’s email newsletter.
The County Health Rankings & Roadmaps project gathers data about every county in the United States to measure how their health factors and outcomes stack up compared to each other and the state as a whole.
This project measures two aspects of health. First, it ranks overall health itself, as measured by the length and quality of people’s lives. Length of life is measured using years of potential life lost, through tracking deaths that occur before life expectancy is reached. Quality of life, meanwhile, is based on several specific measures, including the proportion of people who say they are in poor or just fair general health, and the average number of days people report having poor mental health.
Second, County Health Rankings & Roadmaps summarizes factors contributing to overall health — individual health behaviors, social and economic conditions, access to healthcare and the quality of the physical environment. Examples of key behaviors include smoking, obesity, physical activity and alcohol use. Social and economic conditions are measured by rates of poverty, unemployment, education and violent crime. Access to healthcare includes measures of access to physicians, dentists and mental health professionals, as well as rates of uninsurance. Finally, measures of the physical environment include air pollution, commuting distances, and water and housing quality.
Each factor is weighted according to how much it contributes to overall health. Adult smoking rates and employment status are the largest contributors to the overall health factor score.
An interactive graphic illustrates the contributions of social, economic and environmental conditions to overall health outcomes around Wisconsin in 2018. Every county in Wisconsin is ranked in terms of health outcomes (left) and the factors that affect health (right). Each contributing measure is shown in a bubble, and the size of the bubble indicates the weight of its contribution to the overall score. Clicking one of the measures will display more specific details in a chart.
In 2018, Wisconsin's healthiest county — in terms of both health factors and outcomes — is Ozaukee. The affluent, mostly white suburban counties neighboring Milwaukee generally rank highly: Washington is fourth, and Waukesha is fifth in terms of health outcomes. In general, the top-ranking counties are in suburban and exurban areas, outside of our major cities but within an easy commute to one.
On the other hand, Milwaukee and Menomonee counties have the most health factor challenges and are also the lowest-ranking on health outcomes. These two places are notable for high rates of poverty, unemployment and other unfavorable economic conditions, as well as populations of disadvantaged people of color.
Wisconsin's very rural counties also rank poorly for overall health factors and outcomes. Except for Milwaukee and Racine counties, the lowest-ranking counties are also among Wisconsin's most remote and rural, with most in the northern part of the state. In ascending order from the lowest-ranked in terms of health outcomes are Menomonee, Sawyer, Adams, Langlade, Washburn, Vilas, Florence, Iron, Ashland and Forest counties.
There are broad similarities in how Wisconsin's counties rank individually in terms of health factors and outcomes. But health factors and outcomes rankings do not always match up. The health factors examined by the project are just some of the many things that can affect health outcomes. There are some counties that have better health outcome rankings than might be expected based on their health factor rankings, and vice versa as well. For example, in the northern part of the state, Barron, Clark and Taylor counties had higher rankings for health outcomes than factors, while Oneida County was the other way around. Meanwhile, in the southwestern corner of the state, Vernon County ranked higher for health factors than its outcomes.
The County Health Rankings & Roadmaps project is a collaboration between the Robert Wood Johnson Foundation and the University of Wisconsin-Madison Population Health Institute. It has issued county health rankings since 2010.
Editor's note: This article is corrected to note that County Health Rankings & Roadmaps has produced reports since 2010.
Comparing Wisconsinites' Health In 2018, County By County was originally published on WisContext which produced the article in a partnership between Wisconsin Public Radio, Wisconsin Public Television and Cooperative Extension.
This report was produced in a partnership between Wisconsin Public Radio, PBS Wisconsin and the University of Wisconsin Cooperative Extension. @ Copyright 2024, Board of Regents of the University of Wisconsin System and Wisconsin Educational Communications Board.


